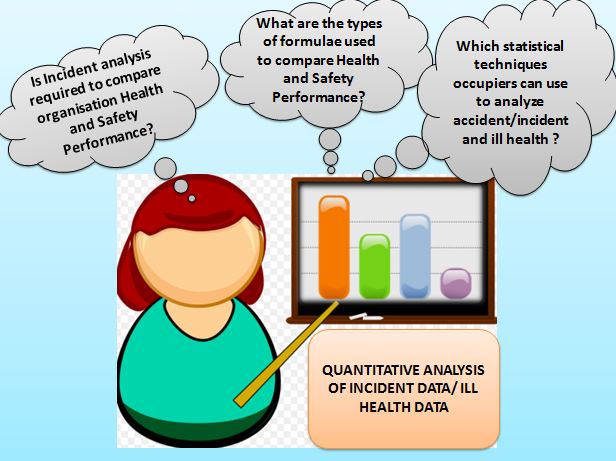
What are the types of formula used to compare Health and
Safety Performance? Which statistical techniques occupiers can use to
analyze accident/incident and ill health? Is Incident analysis required to compare
organisation Health and Safety Performance?
You cannot manage, what you cannot measure (.i.e. Peter F
Drucker). So measuring health and safety performance is vital for any
organisation, country so as to take decisions for further improvements and find
the gaps in the existing efforts. Measuring health and safety performance
should be quantitative wherever possible. This can be made easy with the help
of different formula used by countries like US and UK (HSE and OSHA) to
compare health and safety performance. Types of formula used to compare health
and safety performance differ from country to country.
However below mentioned
formula are common while doing comparison of health and safety performance
among country, organisation, states, within Group Company etc.:
Total Injury frequency rate = [(Number of lost time injury +
Number of medical treatment injury) / Total number of man hours worked] X
1000000.
Lost time injury frequency rate= [Number of lost time
injury/ Total number of man hours worked] X 1000000.
Lost time Severity Rate = [Number of Man days lost/ Total
number of man hours worked] X 1000000.
Frequency Rate = [Number of accidents/ Total number of man
hours worked] X 1000000. (United Kingdom).
Incidence Rate = [Number of accidents/ Total number of
persons worked] X 100000. (United Kingdom).
Severity Rate = [Number of man days lost/ Total number of
man hours worked] X 1000. (United Kingdom).
Mean Duration Rate= Number of man days lost / total number
of accidents. (United Kingdom).
Incident Rate= [number of
recordable incident / Total number of labor hours worked] X 20, 0000
(OSHA)
So it is clear that UK (It means HSE) use 1000000 and US (It
means OSHA) use 20, 0000. So one should take care while comparing these
countries health and safety performance.
Epidemiological analysis & Statistical Techniques:
Epidemiological meaning is relating to the branch of medicine
which deals with the incidence, distribution, and control of diseases. (
Ref:
www.google.com).
So as name suggests epidemiological analysis first initiated
to determine the cause, trends, location of epidemic diseases like cholera etc.
Experts use this type of analysis to eliminate the root cause of the disease.
So statistical techniques has been used to analyze the epidemiological analysis
and in similar manner occupier can determine the location, group of people, age
of people, specific workplace etc prone to accident/ incident by using statistical techniques.
Byssinosis, also called "brown lung disease" or
"Monday fever", is an occupational lung disease caused by exposure to
cotton dust in poor ventilated workplace. Doing statistical analysis one can
easily understands among girls it is common, fabric, thread and yarn manufacturer
industry is more dangerous, region like US suffered 81 fatalities from 1990 to
1999. North Carolina maximum affected area, South Carolina and Georgia are also
suffered locations.
This all above mentioned data for Byssinosis possible to
analyze because of the statistical techniques. Different data dimensions can be
analyzed using statistical techniques. Data dimension means single similar data
like area of injury; multiple data dimension like parts of body, area, age etc.
Different type of graphs can be used like pie chart, Line
graph and bar graph for statistical analysis.
Pie Chart: Coloured 360 degree Circle shape, different
categories and percent distribution, number distribution can be done for
accident/incident.
Bar Graph: X and Y axis and coloured Rectangle bars used to
analyze high or low accident /incident data.
Line Graph: X and Y axis and one continuous line going sometime
low, sometime high to indicate the quantity, percentage etc. of accident/
incident.
So it is apparent that accident /incident can be analyze
using statistical techniques like Pie chart, Line graph and bar graph. This is
very useful tool to pin point the exact cause of accident/ incident and can be
proven a tool to solve the accident/incident cause at workplace. Also LTIFR
(Lost time frequency rate) , LTISR (Lost time severity rate) etc. can be analyze
using statistical techniques over month , years etc by organisation to compare
their health and safety performance by time. Also this can be done to set benchmark
, compare performance with other organisations etc.


Howdy are using Wordpress for your blog platform? I'm new to the blog world but I'm trying to get started and set up my own. Do you require any html coding knowledge to make your own blog? Any help would be really appreciated!decking handrail systems
ReplyDelete